Slide 1 / 14
A graph connects two quantities
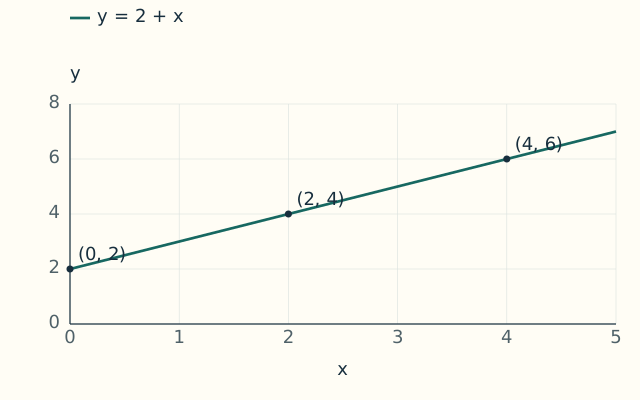
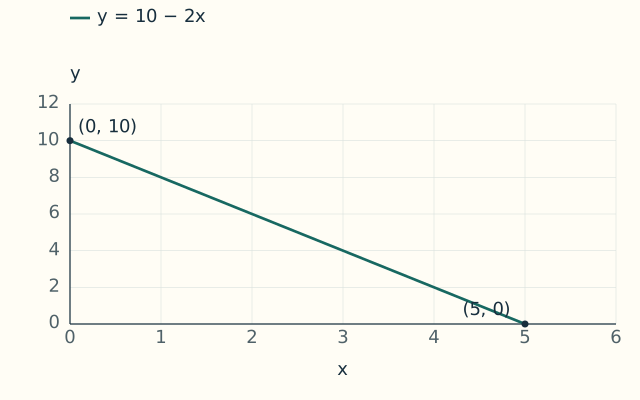
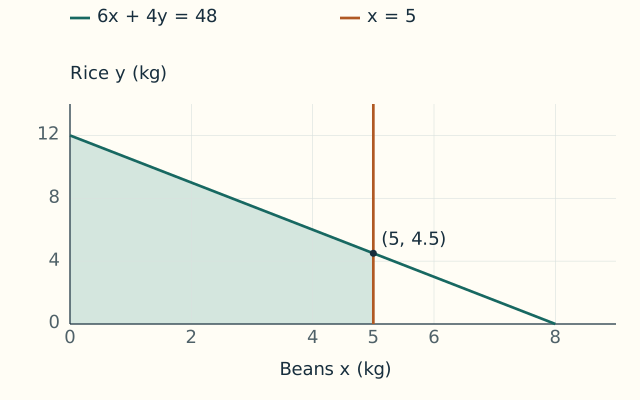
A coordinate graph has a horizontal axis and a vertical axis. Label each axis with its variable and unit. Their crossing is the origin, usually (0, 0). A point represents a pair of values. In this lesson, draw simple graphs on paper as you read; the instructions specify the coordinates and boundaries you need.
Walkthrough and explanation
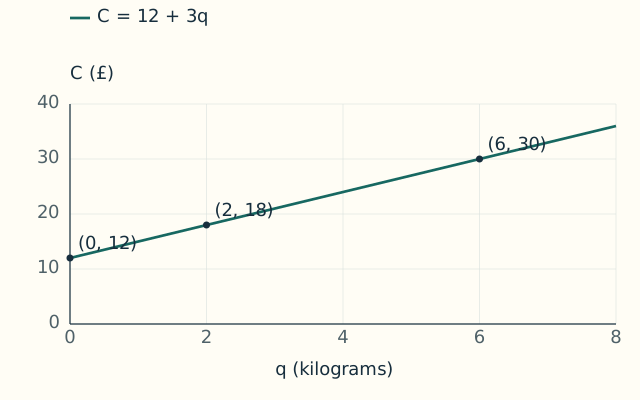
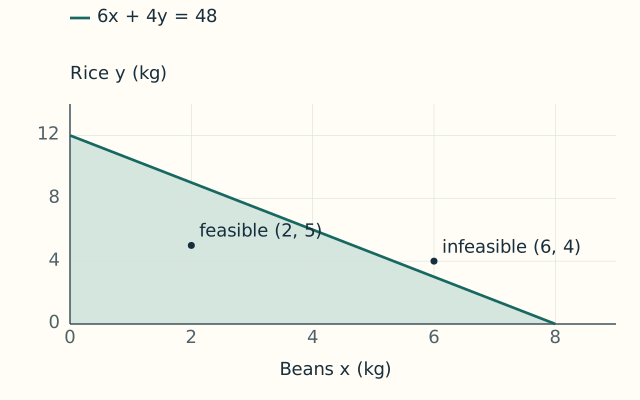
A graph is another language for the relationships we have been calculating. One position records two values at once, allowing us to see patterns that are harder to notice in a list. Start every drawing by naming the quantities on the axes. “Quantity, in kilograms” and “cost, in pounds” are more useful labels than x and y alone. We conventionally put x horizontally and y vertically, but economic graphs may use other variable names or particular axis conventions. Read the labels rather than assuming. Every numerical graph in this lesson is an invented teaching model, not evidence about an actual market.